TruUcde Rabbithole 06/12 : Code Coverage

In the last article we configured our unit testing tools and did some sanity tests to make sure they were working. Along the way we kept getting the error:
Error: Incorrect whitelist config, no code coverage will be generated.Let’s fix this and have a look at what a code coverage report is.
What is the whitelist
We need to revisit our unit test xml configuration file, phpunit_unit.xml. The example file of Tom McFarlin’s that we used had a <logging> section which specified a coverage report. Recent versions of php also require a <filter> section with a <whitelist> subsection. The purpose of this section is to identify what code is, and more importantly is not, included in the coverage report.
What is the purpose of the coverage report, though. A coverage report analyzes the code and its corresponding tests and reports on how much of the code is “covered” by the tests we’ve written. This lets us know if we’ve fully tested all our code.
It is easier to achieve 100% code coverage on smaller projects, like the one we are looking at in this article series , than it is on large projects. Typically large commercial projects will specify a coverage percentage, 80%, 90%, etc. that is satisfactory for their code quality. There is a point where the writing of additional tests is time consuming and may have trivial impact.
The <filter> code
My first stop was the <filter>/<whitelist> documentation on the PHPUnit website https://phpunit.readthedocs.io/en/7.5/configuration.html#the-filter-element.
<filter>
  <whitelist processUncoveredFilesFromWhitelist="true">
    <directory suffix=".php">src</directory>
    <exclude>
      <file>src/autoload.php</file>
    </exclude>
  </whitelist>
</filter>
Now, some things are obvious, others not so much. We definitely have to configure this for our own circumstances. As I was configuring and checking, I kept getting the following error (plus the call stack which doesn’t appear below.)
Fatal error: Uncaught Error: Interface 'Behat\Behat\Context\Context' not found in /Users/twelch/www/sites/multibox/wwwroot/wp-content/plugins/truucde-blog/vendor/10up/wp_mock/features/bootstrap/FeatureContext.php on line 11I recognized my paths and the word “Interface” from object oriented programming but could make little sense of this. So I copied the error, without my specific paths, and dropped it in a search engine to see what the internet made of it.
The advice to replace processUncoveredFilesFromWhitelist="true" from inside the opening <whitelist> tag with addUncoveredFilesFromWhitelist="true" was purported to solve the problem. And it did. Admittedly I need to circle back and figure out why but for now my curiosity is satisfied.
The next thing I noticed was the <exclude> section, which excludes that file from coverage processing. I don’t have a src directory with that file in it, so I removed the <exclude> section for the time being, noting that I may at some point want it back. I also noted that the <directory> section above specified the src directory referred to in the exclude section. So obviously one file out of that directory was being left out.
Another thing that wasn’t so obvious, at first, was that in addition, or instead of, a <directory> section you could have a <file> section. Also, you can have more than one of each.
Also, I discovered in some internet searching that you could specify an html version of the coverage report that was much pretty to look at.
Okay, so my first go around of the phpunit_unit.xml file looked like this (only the <filter> and <logging> sections appear here:
    <filter>
        <whitelist addUncoveredFilesFromWhitelist="true">
            <directory suffix=".php">.</directory>
        </whitelist>
    </filter>

    <logging>
        <log type="coverage-html" target="./tests/unitTests/coverage" showUncoveredFiles="true"/>
    </logging>
I had already deleted my sanity test files, so I use the truucde.php file for code and its corresponding tests that we will look at a couple of articles from now. In the directory statement in the XML file I just used a period (.) which is linux-speak for “the current directory” since my code file is in the same directory as the phpunit_unit.xml file. Also it is worth noting the suffix attribute which makes sure only php files are analyzed.
In the logging statement I changed the type attribute to generate an html coverage report and specified the directory I wanted it in with the target attribute. I will want separate coverage tests for the integration tests, so it makes sense to tuck these into their respective tests directories. The showUncoveredFiles attribute I left set to true. In most projects this will be useful to show files needing tests still.
Then I ran my unit tests (which I know already all work okay) again. The tests took 7.5 seconds to run which is not too bad, but the coverage report took about 2 minutes. That’s going to be excruciating when we are writing a test, tweaking it, checking it and writing again. Hmmm, what can be done?
Well, let’s start off by looking at the coverage report in a web browser.
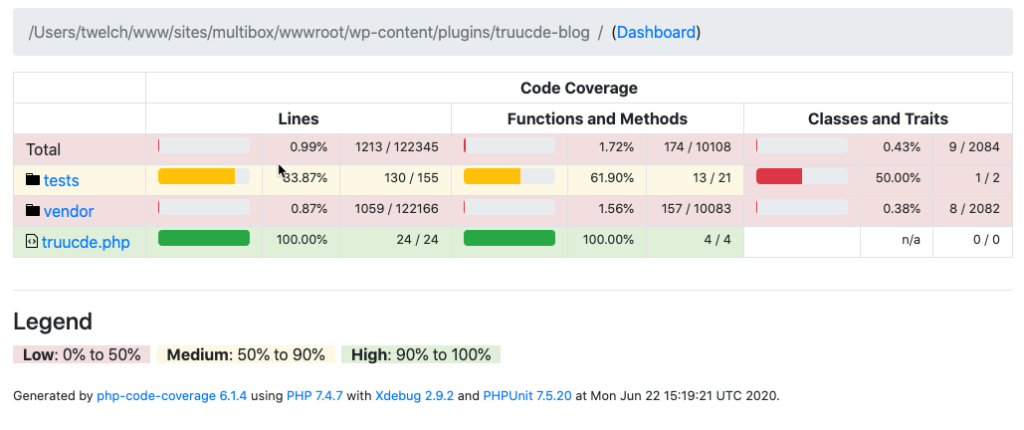
Do you see why it took so long to run? Apparently it analyzes the specified directory and all its subdirectories, including the 122,348 lines of code in the vendor directory. It was actually at this point when I discovered and tried replacing the <directory> section with a <file> section pointing at the sole code file in this project that we are interested in.
    <filter>
        <whitelist addUncoveredFilesFromWhitelist="true">
            <file>./truucde.php</file>
        </whitelist>
    </filter>
Seconds. It processed almost instantly, granted it’s a small file of code though. Still, the lesson is to set up <directory>, <file> and <exclude> to process only your code files. Our coverage dashboard now reflects this approach:
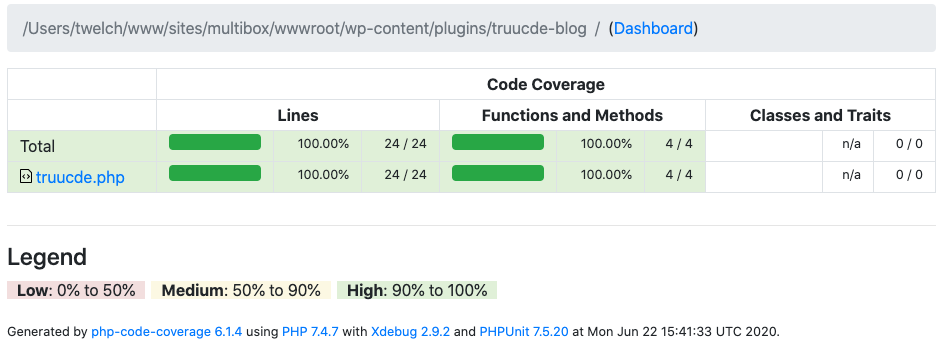
That’s better, just the file we need and green across the board. Note that the file name is clickable, let’s click through and have a look.
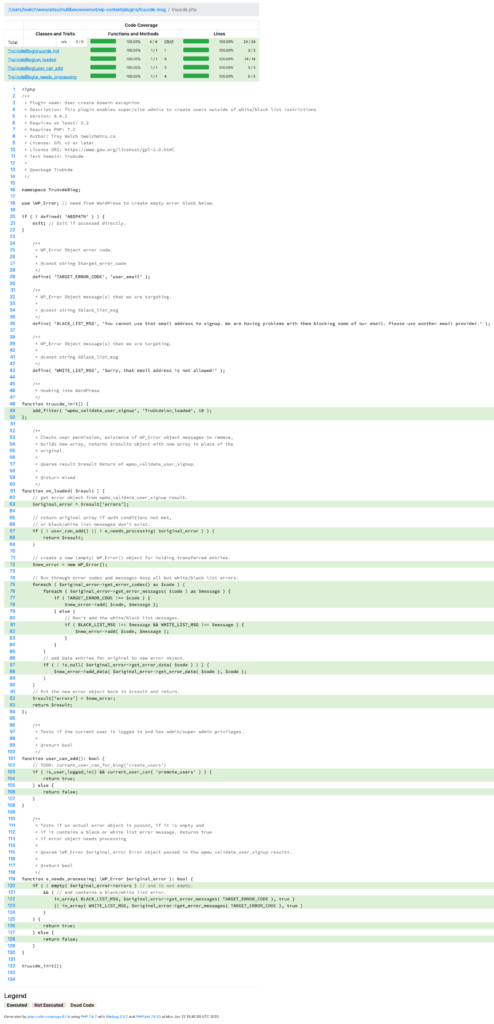
Lots of nice information here. It first breaks down coverage by function in the file. Then below where it repeats the code it highlights the actual working code with a colour: green for Executed (which means executed in a test), red for Not Executed (which means we need to write a test for it) or yellow for Dead Code (which typically means that the code is unreachable.) And lines that aren’t coloured at all are either comments or code structure items such as brackets.
Okay, that’s all we need to cover with respect to coverage (sorry about that). Let’s look briefly at some testing approaches and then get on to some actual unit tests.